
Ask most football clubs how much carbon a matchday produces, and they could probably give you an estimate. However, very few could give you a measured number. Blues Go Green set out to change that.
What is Blues Go Green?
Blues Go Green is a partnership between Enistic and Birmingham City FC. It’s a practical step in our work together to understand the club’s environmental impact and, over time, bring its footprint down. A measured baseline shows exactly where to start, and it gives other clubs and businesses a clear example to follow.
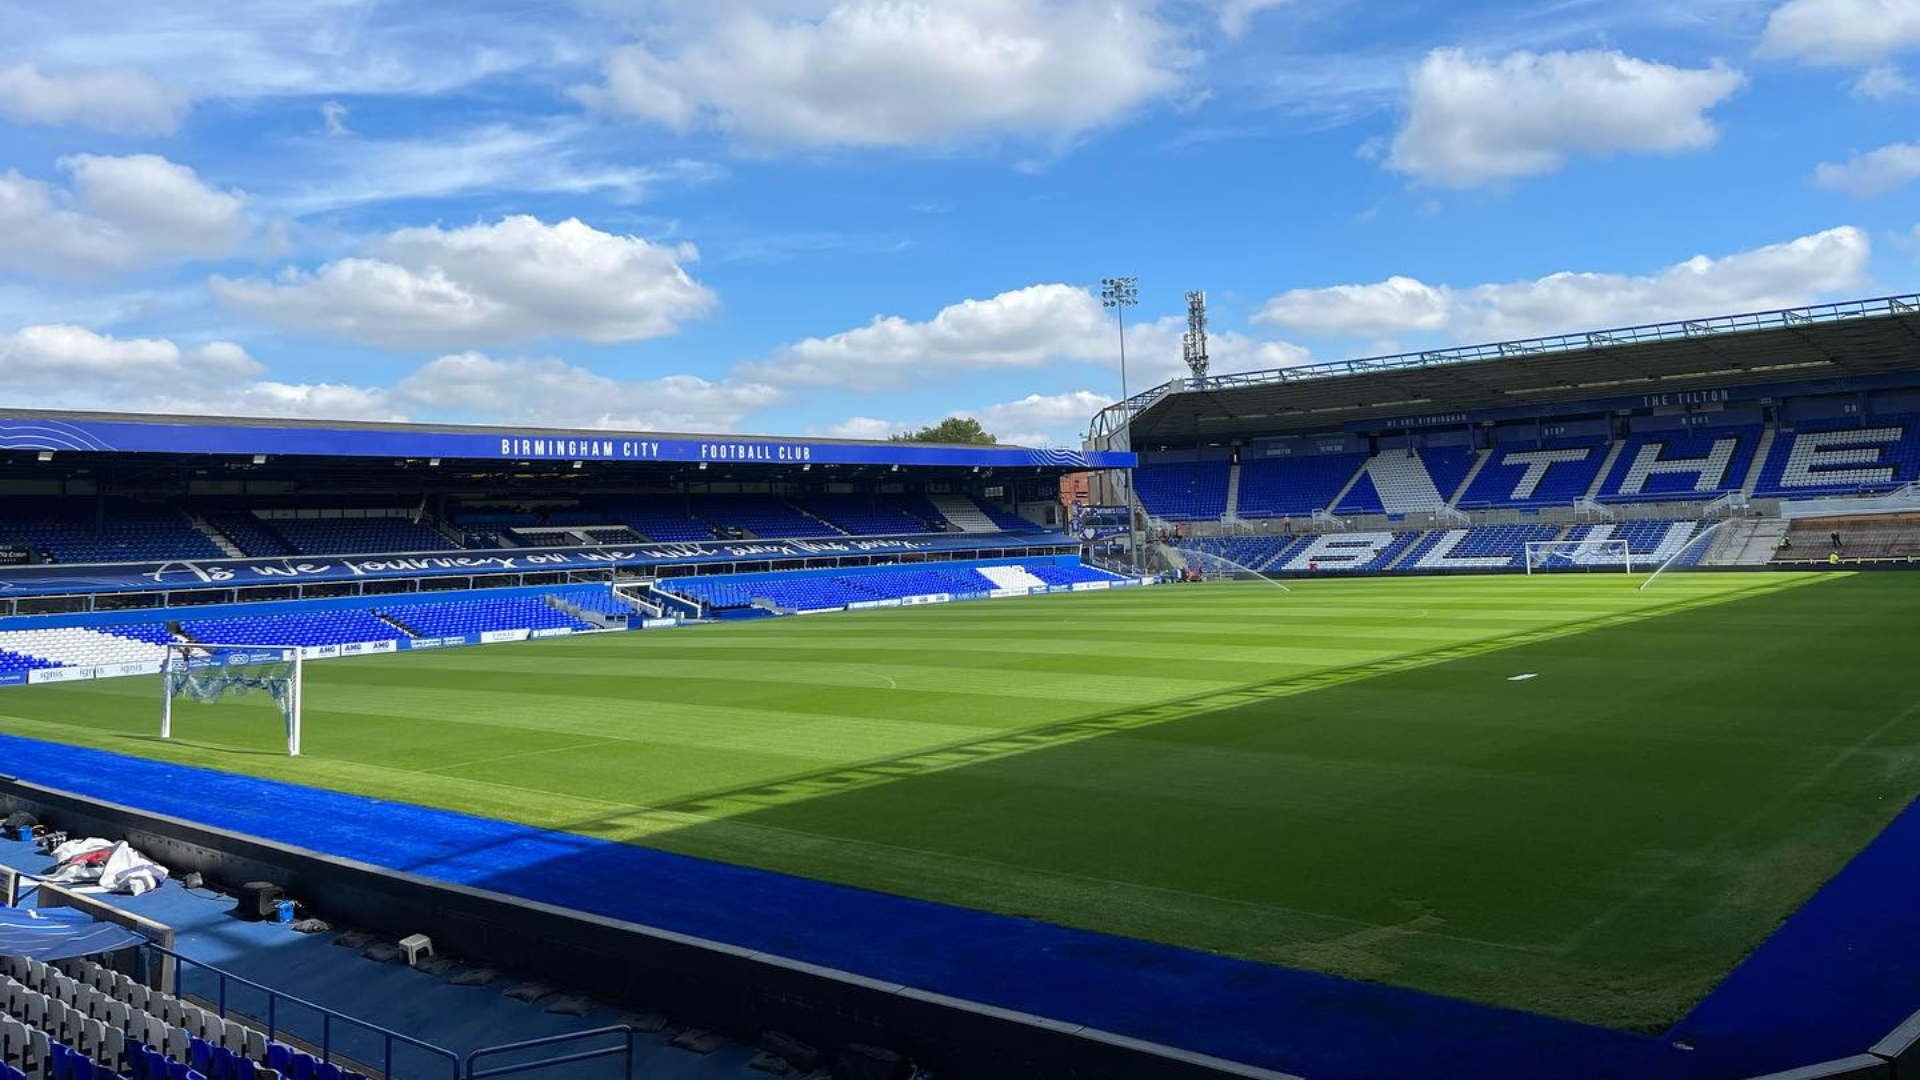
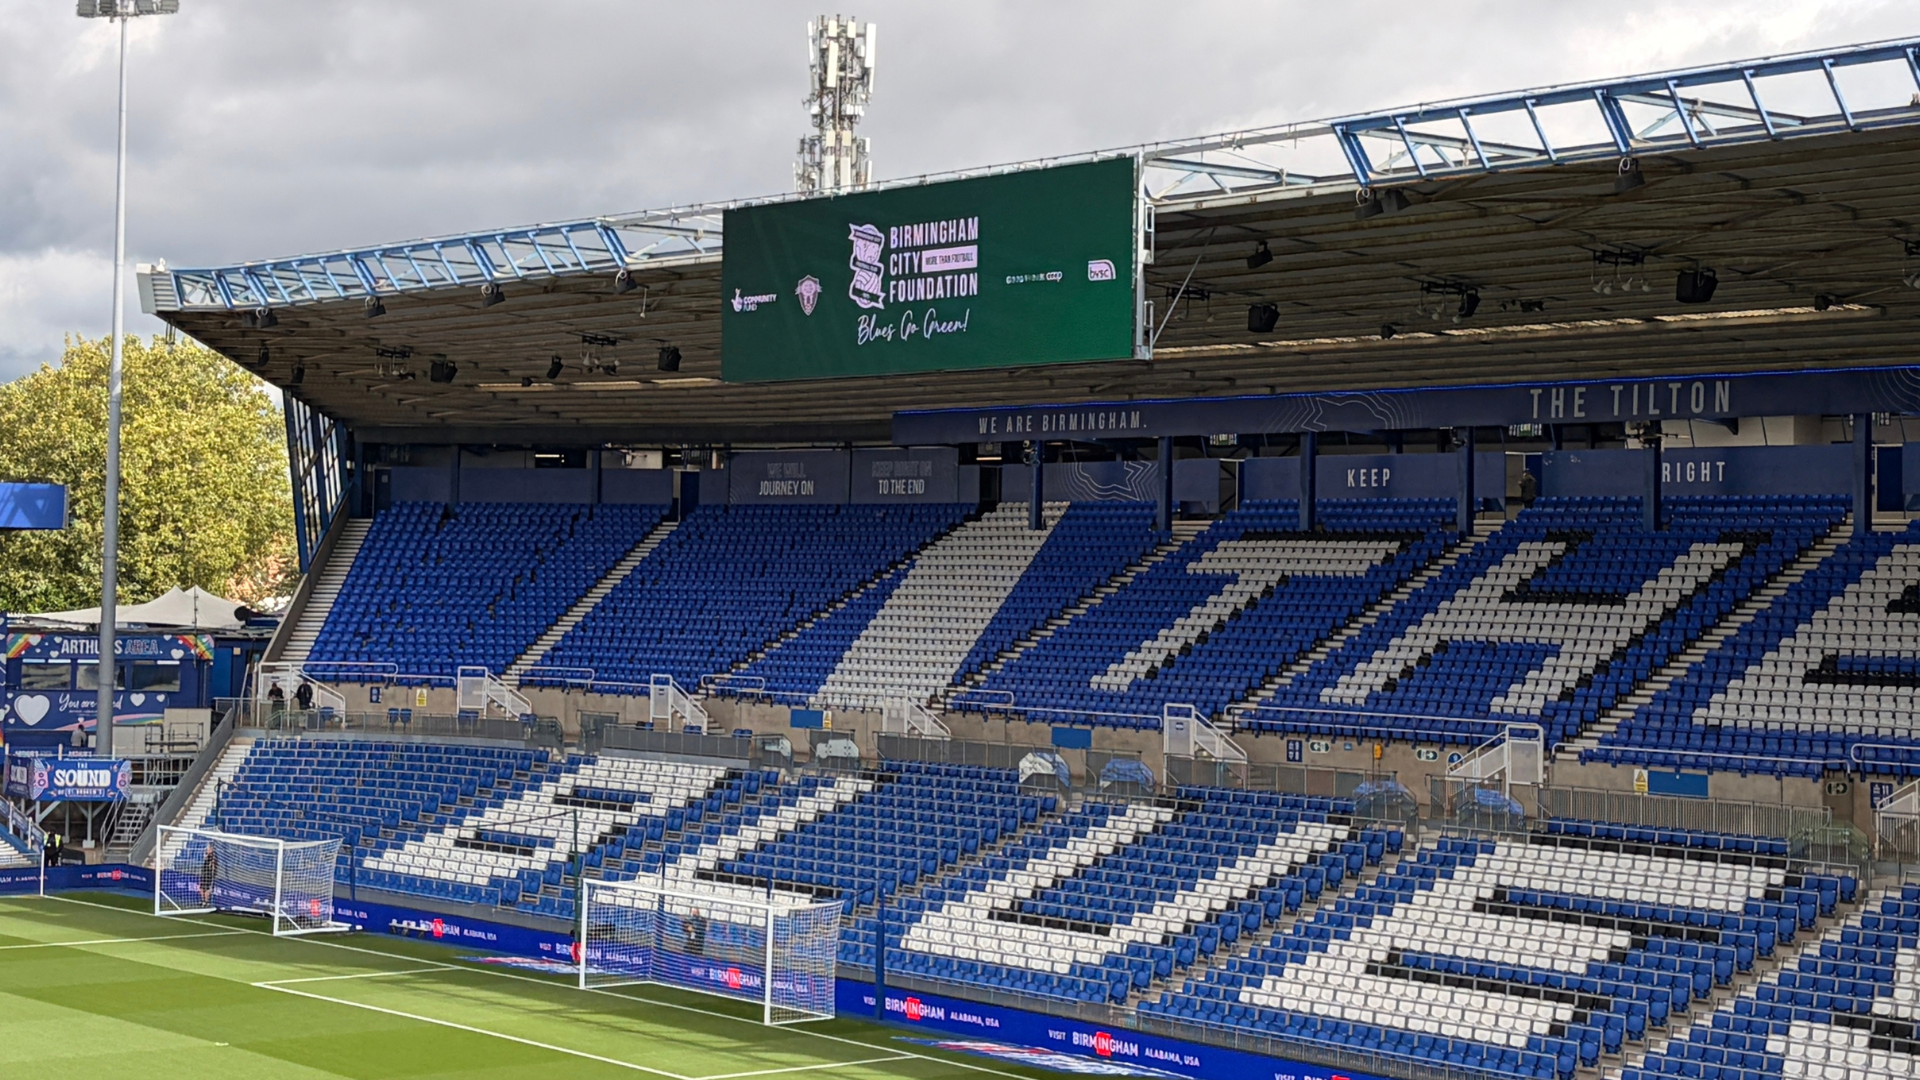
We measured the Birmingham City vs Middlesbrough fixture at St Andrew’s on Saturday 19 September 2026. We started when the first member of staff switched the lights on, and finished when the last one left. The footprint covers four areas: travel, catering, waste and water, and energy.
To capture travel, posters around the stadium carried QR codes linking to a short survey. Fans could then tell us exactly how they got to the ground.
We measured the other three areas on site. First, we took energy and water meter readings at the start and end of the day. Next, we counted catering stock before and after service to see how much food and drink went out. Finally, we recorded waste throughout the day.
Why Measure a Single Matchday?
Measuring one matchday in detail gives the club a real baseline to work from. It’s built on data from the day itself, rather than an industry average or a best guess.
We kept the scope deliberately focused. This isn’t the club’s season or organisational footprint. Instead, it’s a detailed look at a single game, which makes it easier to see where emissions come from and what to do about them.
A matchday is also when a club’s emissions are at their most concentrated. Fans travel in from across the region and beyond. Meanwhile, catering teams serve food and drink all afternoon, and the stadium runs at full capacity for hours. As a result, one fixture gives a clear picture of where the biggest sources sit.
What Does a Matchday Carbon Footprint Include?
Each of the four areas looks at a different part of the day. Travel is about how people got to and from the ground. Catering includes the food and drink served across the stadium. Waste and water looks at what the stadium used, threw away and recycled. Finally, energy is the power needed to run the stadium from start to finish.
We then convert all four into tonnes of CO2e. That way, they add up to a single matchday total.
Enistic at St Andrew’s: What Happened on Matchday
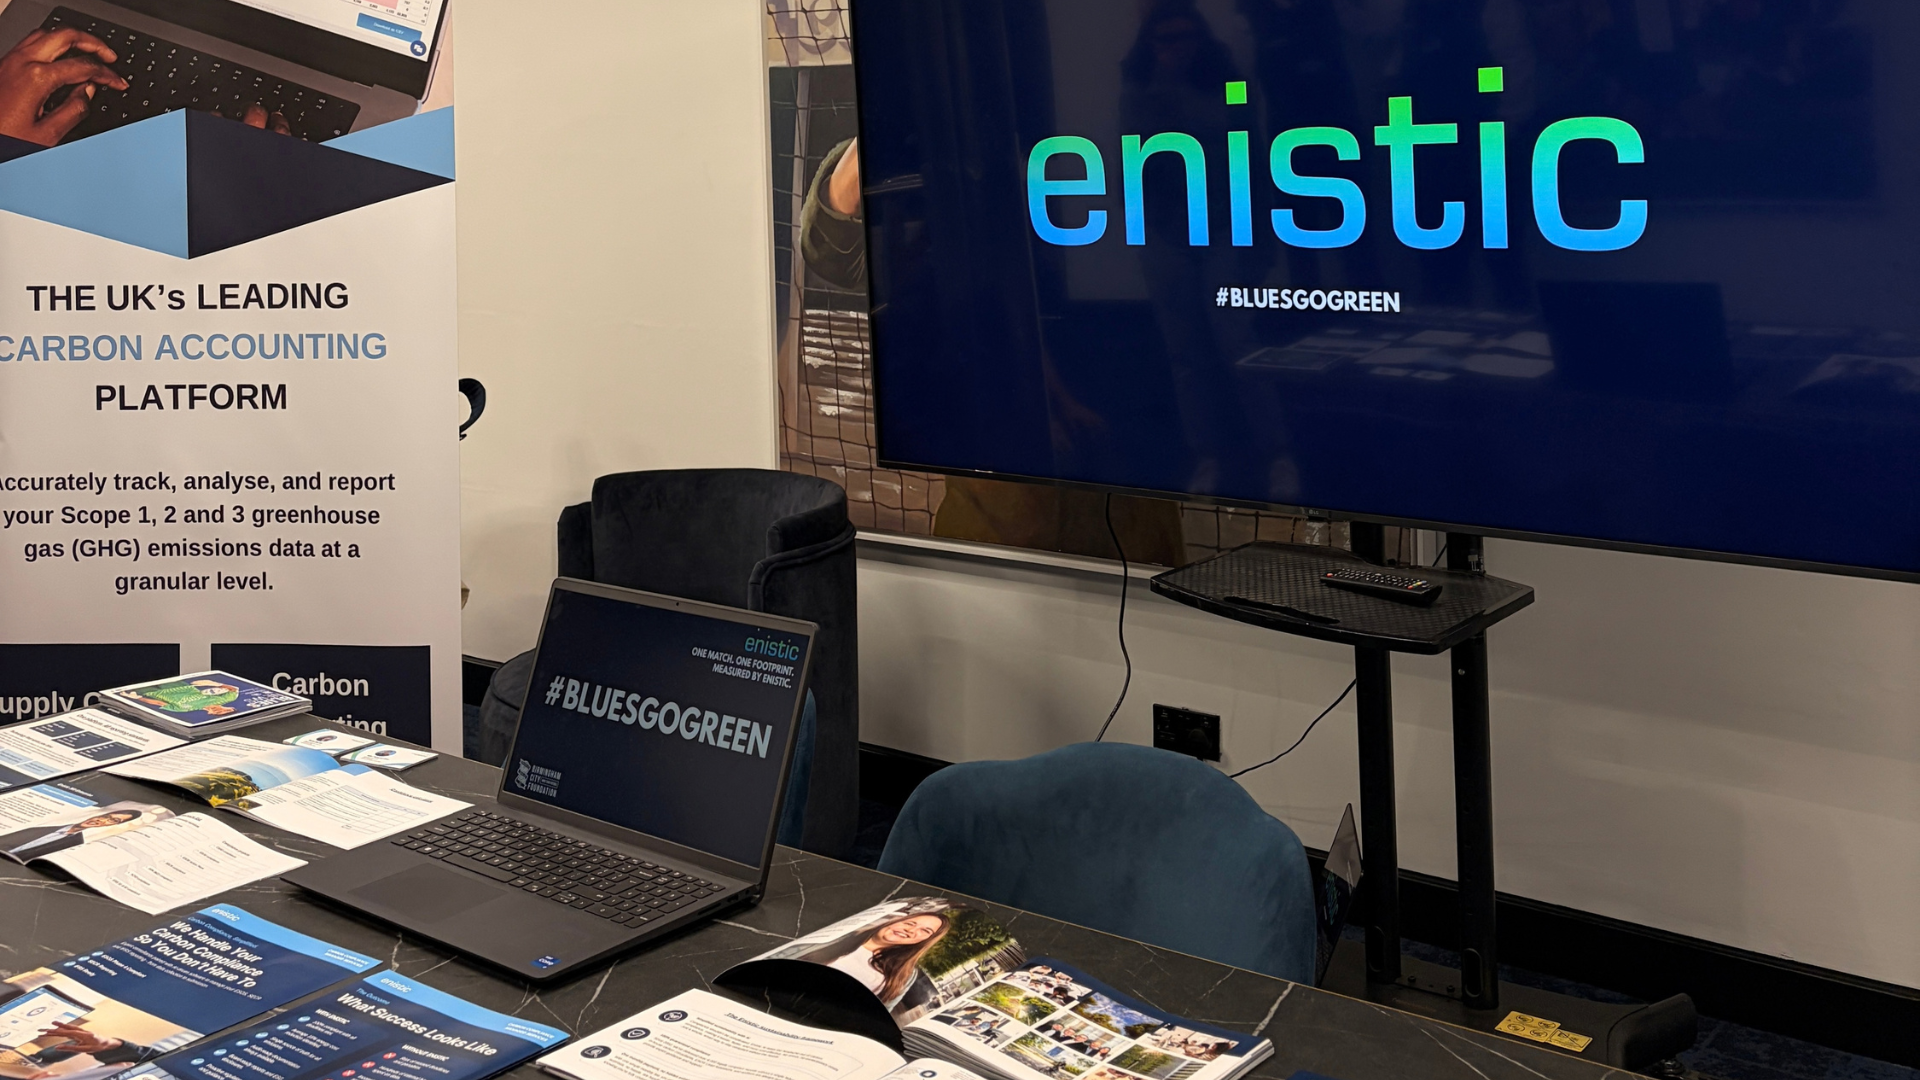
Our team spent the day at St Andrew’s, running a stand in the hospitality area. Fans and business owners stopped by to hear how a footprint like this comes together. For businesses, it was also a chance to ask what measuring their own might involve.
We also asked everyone to guess how many tonnes of CO2e a Birmingham City matchday adds up to. When we share the results, we’ll reveal how close people got.
Thank you to the Birmingham City FC Foundation, the club’s team and every fan who filled in the travel survey. Your answers turn this into a real measurement, rather than an estimate.
When Will the Results Be Published?
Our consultants are now working through the data, one category at a time. Once they’ve verified and signed off the full footprint, we’ll share it with Birmingham City first. After that, we’ll publish it here. It’s the same standard we apply to every report we produce.
The results will show where the day’s emissions really come from, and where the biggest savings are likely to be. Then, we’ll work with the club to turn them into a plan for bringing its footprint down.
We’ve been sharing Blues Go Green on LinkedIn since the build-up to the match. Once the club has seen the results, we’ll share the results on there too. Follow Enistic on LinkedIn and keep an eye on #BluesGoGreen and so you don’t miss them!

What Does This Mean for Other Clubs and Businesses?
The same approach works for any football club. If you’re at a club and want to understand your matchday footprint, we’d be glad to talk. It can start with a single game.
The principle is the same for businesses. ESOS, SECR and PPN 006 Carbon Reduction Plans all depend on accurate, evidenced data rather than estimates. Since 2002, Enistic has delivered more than 5,000 reports with a 100% compliance record.
If your organisation is still guessing at its footprint, we can help. Book a free consultation with our team.